Best time to trade gold
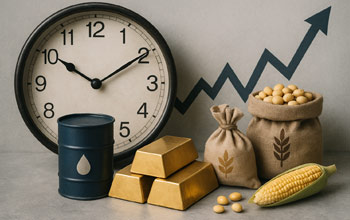
Knowing the best time to trade commodities helps maximize volatility and liquidity. Oil, gold, natural gas and agricultural markets each have peak trading hours.
{etoroCFDrisk}% of retail CFD accounts lose money - You never lose more than the amount invested in each position
Commodity trading hours are shaped by the schedules of major exchanges such as NYMEX, COMEX and CME Globex, as well as by the broader availability of CFDs. Global session activity, economic releases and regional liquidity also influence how commodities behave throughout the day. These elements help explain timing patterns observed in different markets.
Price movement often aligns with periods when large financial centers operate simultaneously. This is why session overlaps between Europe and the United States are frequently referenced in market studies. During these hours, liquidity increases and economic data releases are more common, which can contribute to more noticeable fluctuations in several commodities.
No. Energy products like crude oil and natural gas often react to scheduled inventory reports, while metals may respond to interest-rate announcements or macroeconomic indicators. Agricultural commodities follow CME hours and can be influenced by seasonal updates. These differences explain why volatility cycles vary across commodity groups without implying any specific outcome.
Most commodities are available for extended periods thanks to electronic trading, particularly on CME Globex. However, activity levels vary significantly depending on the region and the time of day. Futures have fixed exchange hours, while some derivatives remain accessible for longer periods. These distinctions help illustrate the structure of global commodity markets.
Timing is one of the most important factors when trading commodities. Oil, gold, natural gas and agricultural products all show predictable volatility patterns depending on global market sessions, economic reports and liquidity cycles. Understanding when prices move the most allows traders to plan entries, manage risk and focus on periods of high activity. This guide explains the best time to trade commodities, including ideal hours for metals, energy and agricultural markets, when volatility peaks, how session overlaps impact price action, and how to adapt your strategy to market conditions.
📌 Key Essentials — Best Time to Trade Commodities
- ⏰ Peak volatility during session overlaps: London–New York overlap offers the strongest moves across gold, oil, indices and major commodities.
- 🛢️ Oil is most active during US mornings: WTI and Brent react strongly around NY open and energy news releases.
- 🟡 Gold moves during London & NY sessions: XAU/USD volatility peaks when both markets overlap.
- ⚡ Natural gas spikes around inventory data: Weekly EIA reports create sharp intraday movements.
- 🌾 Agriculture follows CME hours: Wheat, corn and soybeans are most active around US trading sessions.
The timing of global market hours plays an important role in how commodities behave. Each asset class—whether metals, energy or agriculture—reacts differently depending on the level of activity in major financial centers. By understanding how trading hours, liquidity cycles and international session overlaps work, traders can better interpret market conditions without relying solely on price movements from a single time zone.
The commodity market trading hours depend on the exchange where the product is listed. Commodity futures trading hours follow the schedule of venues such as NYMEX, COMEX, ICE or CME Globex, each with their own opening and closing times. In contrast, many brokers offering derivatives operate with commodity CFD market hours that extend for most of the day, aside from short maintenance breaks.
🕒 Key characteristics (informational)
These structural differences influence the level of liquidity and the pace at which prices may fluctuate during various parts of the day.
Market participation tends to increase when major financial centers open or overlap, which affects the best time of day to trade commodities from a purely observational standpoint. Increased institutional activity can coincide with more pronounced price movements.
Periods often monitored in market analysis include:
These observations describe general market behavior rather than suggesting how or when anyone should trade.
When two major financial regions operate simultaneously, analysts often note higher activity levels in several commodities. This is why session overlaps are regularly referenced when describing the most volatile commodity trading hours.
🔁 Common overlaps referenced in market studies
Because these windows involve concentrated participation, they are often mentioned when studies refer to session overlaps commodities volatility. These descriptions do not indicate whether such conditions are favorable or unfavorable, but simply reflect observed patterns in market behavior.
Gold is among the most globally followed commodities, and its activity often reflects the opening hours of major financial centers. Market studies frequently compare the behavior of gold during the European and American sessions to better understand liquidity cycles and volatility patterns.
Gold tends to show distinct phases of activity that align with international market schedules. Educational materials often mention the best time to trade gold in relation to the European and US trading days, without implying any performance advantage.
Research commonly highlights:
➡️ Learn more in our informational guide on gold trading.
Market studies discussing gold trading hours explained often describe how activity levels vary throughout the day. Analysts frequently reference:
These elements provide context on how gold behaves during different phases of the global market day.
When examining historical behavior, analysts sometimes describe when is gold most volatile, especially during periods that coincide with global announcements or overlapping market sessions.
Observations often include:
These descriptions do not form trading recommendations but serve to explain how gold’s activity tends to evolve across different parts of the global trading day.
Oil is one of the most widely observed commodities, and its daily activity often reflects global market participation across Europe and the United States. Analysts frequently refer to specific hours during which WTI and Brent show notable liquidity variations, especially as institutional players become active. These timing cycles are commonly examined in market studies to understand how oil behaves within international trading sessions.
The best time to trade crude oil is often discussed in educational material in connection with periods when liquidity tends to increase. Observations frequently highlight how both WTI and Brent react during the European morning and the US trading day. These references do not imply performance expectations but help describe global participation trends.
🕒 Elements often mentioned in market timing analysis
➡️ Learn more in our informational guide on oil trading.
Historical reviews often note that oil tends to react noticeably during parts of the US session. Educational resources sometimes examine when is oil most volatile, particularly around scheduled economic announcements.
⚡ Commonly referenced volatility conditions
The purpose of these references is to describe market conditions rather than indicate opportunities.
In educational discussions, the best time to trade oil CFDs is often connected to periods when oil derivatives show heightened activity due to global market overlaps. These mentions provide context on how the instrument behaves, without suggesting whether such timing would be suitable for specific strategies.
🕒 Informational points often discussed
These elements aim to provide a descriptive overview of how CFDs reflect fluctuations seen in underlying markets.
Natural gas is known for pronounced intraday moves, largely because of its strong connection to weather patterns, seasonal factors and scheduled inventory updates. For this reason, many market studies highlight recurring timing behaviors that help illustrate participation cycles across the global market.
Natural gas follows specific trading schedules depending on the instrument. Natural gas trading hours vary between Henry Hub futures on CME Globex and the broader availability of CFDs offered by regulated brokers.
🕒 Key timing elements
➡️ You can explore more details in our general natural gas trading overview.
Educational analyses frequently mention the best time to trade natural gas when discussing periods where market activity appears more pronounced. These mentions do not imply potential outcomes but highlight how gas often behaves during global session overlaps or before news releases.
⚡ Observations often cited
The weekly inventory update published by the US Energy Information Administration is widely referenced in educational material. Analysts often discuss natural gas EIA report trading as a factor that influences activity levels.
📰 Key informational points
Agricultural commodities such as wheat, corn and soybeans follow the schedules of the Chicago Mercantile Exchange. Timing references in market education often highlight specific cycles of activity during US trading hours, as this reflects the primary region where these futures are listed.
Analysts sometimes mention the best time to trade wheat, corn or soybeans when studying periods of historically higher order flow. Since these products are heavily linked to the US agricultural market, researchers often examine patterns during CME trading hours.
🌾 Elements often reviewed
➡️ More details are available in our general wheat market overview.
The schedules of agricultural commodities follow CME Globex, and many educational resources summarize these agricultural commodities trading hours to help readers understand how the market is structured.
🕒 Common timing references
In broader commodity education, some analyses discuss when agriculture is most volatile, usually around periods of key economic releases, seasonal updates or crop reports.
⚡ Observational points
eToro is a multi-asset platform that offers both investing in stocks and cryptocurrencies, as well as trading assets in the form of CFDs.
Please note that CFDs are complex instruments and come with a high risk of losing money rapidly due to leverage. {etoroCFDrisk}% of retail investor accounts lose money when trading CFDs with this provider. You should consider whether you understand how CFDs work and whether you can afford to take the high risk of losing your money.
You will never lose more than the amount invested in each position.
This communication is for informational and educational purposes only and should not be considered investment advice or a recommendation. Past performance is not an indication of future results.
Copy Trading is not equivalent to investment advice. The value of your investments may go up or down. Your capital is at risk.
Investing in and holding cryptoassets is offered by eToro (Europe) Ltd as a digital asset service provider registered with the AMF. Investments in cryptoassets are highly volatile. No consumer protection. Tax on profits may apply.
eToro USA LLC does not offer CFDs and makes no representation and assumes no liability as to the accuracy or completeness of the content of this publication, which has been prepared by our partner utilizing publicly available non-entity specific information about eToro.